
What the Peak Season Leaves Behind: Data for Planning 2027
News
September 23, 2026
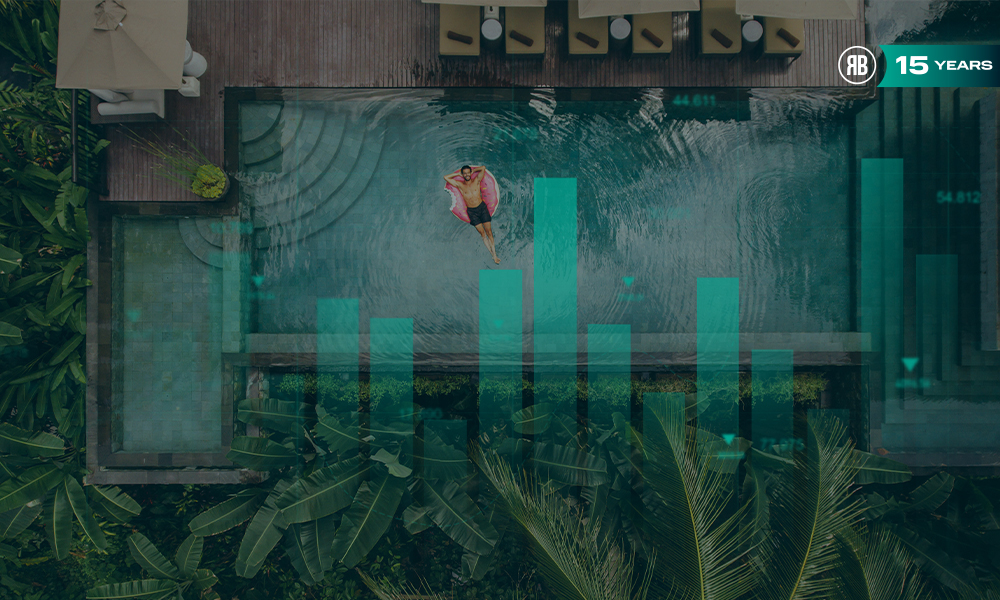
Consumption, waste, emissions, and efficiency metrics: How to turn peak-season data into better decisions for the next fiscal year.

During the summer months, hotels operate under some of the most demanding conditions of the year: higher occupancy rates, increased activity in guest rooms and dining areas, equipment running at full capacity, and more intensive use of energy, water, supplies, and services.
Now that the peak season is beginning to wind down, we’ve reached a particularly interesting time for management: analyzing what actually happened. Because summer doesn’t just yield occupancy rates, revenue, or RevPAR—it also provides insight into how the property performed when its operations were under the most pressure.
Consumption, emissions, waste, food waste, goals, and actions yield data that, when analyzed in context, can help answer a key question:
What can we learn from this season to better manage the next one?
The peak season as a reality check
At the start of the season, it is common to set forecasts, budgets, and goals. However, it is during the busiest months that these plans are put to the test in the real world.
Energy consumption may develop differently than anticipated. Water usage may exhibit patterns that were not apparent during periods of lower occupancy. Waste generation may vary in certain areas, and the measures implemented before summer may yield results that differ from those expected.
That is why closing out the season should not just be about comparing financial results.
It is also an opportunity to review how the hotel has performed from an ESG (environmental, social, and governance) perspective and to identify results, deviations, and areas that require review.
Data needs context
Just because a hotel used more energy in August than in May doesn't necessarily mean it was less efficient. If occupancy has also increased significantly, the picture is different.
The same is true for water, waste, and emissions. Absolute values provide information, but relating them to occupied rooms, guests, overnight stays, or activity levels allows for a better understanding of what has happened.
The question then shifts from “How much have we consumed?” to “How has our consumption changed in relation to our activity?”
Comparing different time periods adds another layer of information. How has water consumption per room changed compared to last summer? Which areas have generated the most waste? What do the indicators show before and after implementing certain measures?
It's not about generating more reports, but rather about having structured information that allows us to interpret the results and use them for management purposes.
What do the summer data tell us?
Nor should the analysis be limited to energy, water, or emissions. The peak season provides an opportunity to review other aspects of ESG management: waste separation and management, measures implemented to prevent food waste, supplier monitoring, and compliance with established procedures during periods of peak activity.
This is also a good time to review your own goals. Which actions have been completed, and which are still pending? Which measures show measurable results in the analyzed indicators? Which goals need to be adjusted?
The results may reveal that some forecasts were accurate, that certain areas require closer monitoring, or that the actions planned for the next fiscal year need to be revised. Data-driven management also involves recognizing the evidence presented by the data and adjusting plans accordingly.
Turn the 2026 results into decisions for 2027
This is where the information gathered over the summer proves particularly useful.
If the data shows high energy consumption in certain areas, it may be time to review facilities, equipment, or processes. If recurring deviations in water consumption appear, it will be necessary to analyze their causes before setting new goals. If the records show differences in food waste depending on the service or occupancy level, that information can be used to review purchasing, production, or F&B planning.
Similarly, when the data show favorable results associated with certain actions, these can serve as a starting point for evaluating whether to continue those actions or implement them in other facilities.
In this way, the goals for 2027 can be developed based on internal data, defined time frames, and comparable results.
The challenge arises when it's time to conduct this analysis and the information is scattered across invoices, spreadsheets, departments, suppliers, and different systems. Structuring this information and maintaining its traceability makes it easier to compare periods, analyze variances, and use the results to support decision-making.
The best place to start for 2027 is to understand 2026
Analyzing what happened during the busiest months allows us to prepare for 2027 on a more solid foundation: data on how the hotel performed when operations were at one of the busiest times of the year.
The Bioscore Data Platform digitizes the management of indicators, consumption, emissions, water, waste, goals, and actions, making it possible to organize and maintain traceability of ESG information. Having this data in an organized format makes it easier to track, compare, and use as a basis for decision-making and setting new goals.
Because planning for the next season doesn't start by looking only toward 2027.
Start by analyzing what the 2026 data reveals.
Bioscore is a technology company specializing in sustainability within the tourism sector. It develops solutions that enable hotels to measure, manage, and improve their environmental, social, and governance performance in a structured, traceable, and evidence-based manner. Are you setting your hotel’s goals for 2027? Contact us!
Read more

News
Roiback Receives Its Sixth Consecutive Award as the World's Best Hotel Booking Solutions Provider
By
Roiback

News
Roiback Participates in the Conference “The Balearic Islands: A Land of Opportunities for Strategic Projects” at the CEOE
By
Roiback
News
Roiback integrates DirectBooker to connect the direct channel with AI assistants
By
Roiback


